Use case description
An intelligence organization collects car activity between different locations and places.
Every short period of time, several statistics are collected for every tracked location. For example,
the incoming and outgoing links (car traffic activity) to and from the tracked location and other locations.
Each category of locations has its own profile of activity during different hours and days. For example, schools have differnt profiles
than coffee shops.
Our challange was to classify the locations based on their car activity and to identify anomalous locations and traffic activity that will lead to
detection of anomalous events, which can provide
indication regarding terror activities.
Our analysis
We used our data mining, anomaly detection and differential diagnosis technologies
to provide accurate classification of traffic activity and detect anomalous events.
The network of links between each pair of locations was used as an input data for our anomaly detection system.
First, we analyzed the corresponding graph to build a global organization of the locations, based on their linkage profile.
Then, we analyzed the per-category graphs to build local organizations of the nodes.
In each organization (global, locals), we looked for anomalous nodes, based on our anomaly detection methods. For each identified anomaly,
we analyzed its linkage profile to detect the anomalous events (periods of time), and the other locations that were part of the anomalous event.
Then, every identified anomaly was used as an initiator for the differential diagnosis process. Each initiator was characterized in order to
find other similar anomalous locations - its anomalous peer group. This process was repeated for every location in the detected peer group and hence,
more anomalous peer groups were detected. The result of this process is that by starting with a limited set of initiators, more
anomalies were detected, and from them other anomalies were detected, thus creating a path of dots between anomalous locations.
The following example shows the global organization of the data and the detected anomalies.
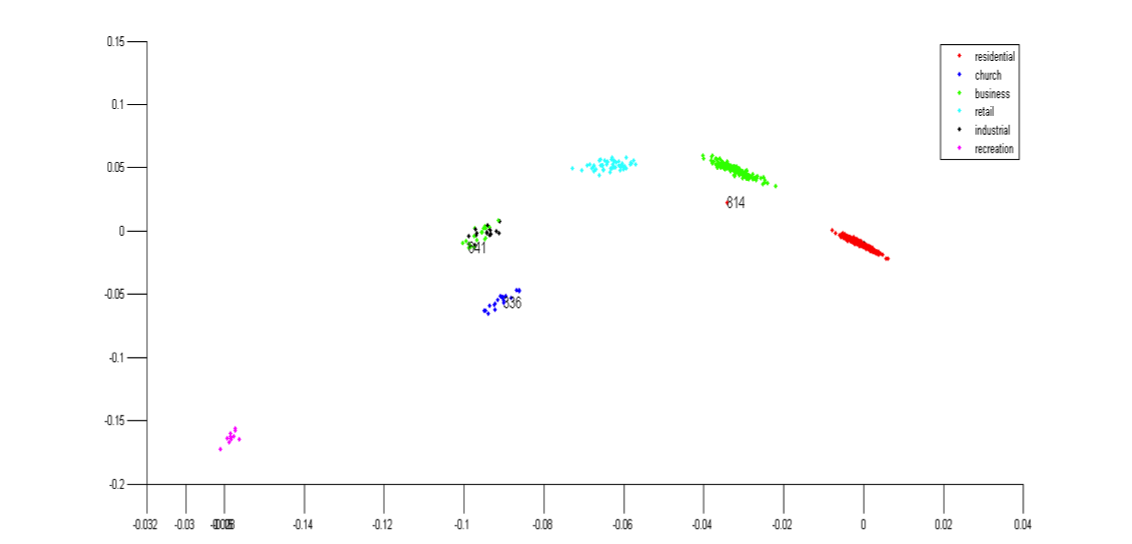
The following examples show several local organizations of the data and the detected anomalies.
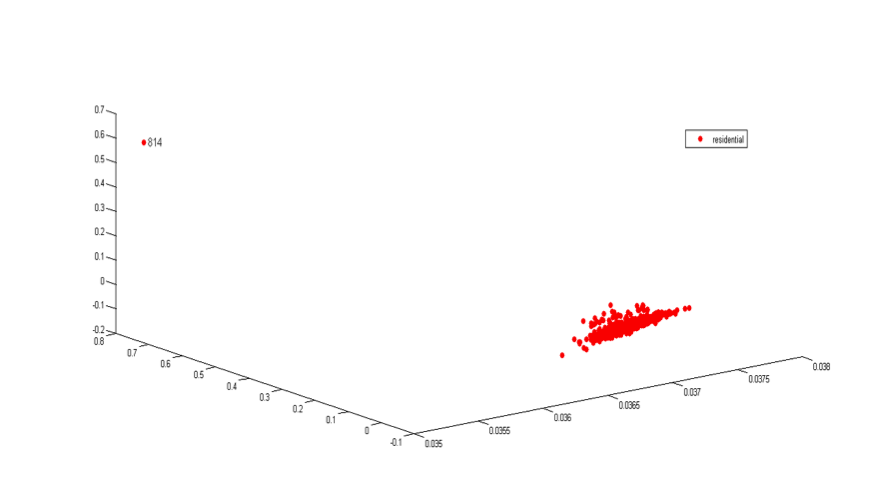
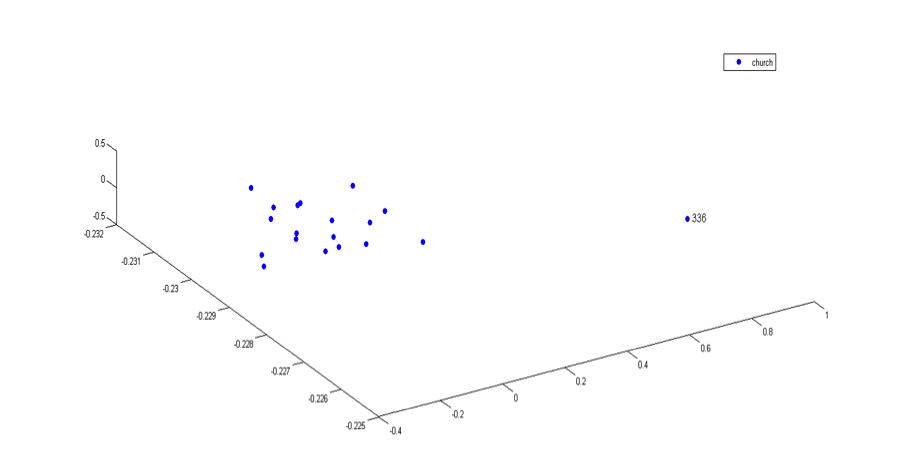
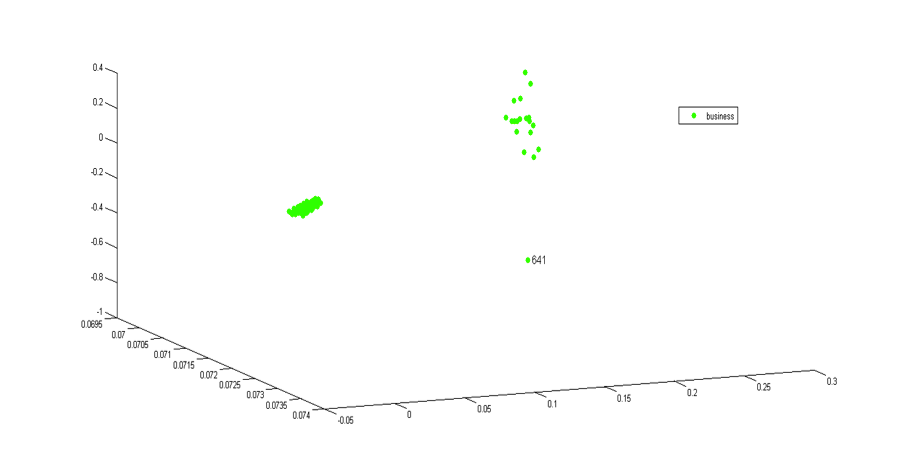
As we can see, the anomalies are well separated from the normal groups.
The following examples show the detection of the anomalous events in each anomalous location.
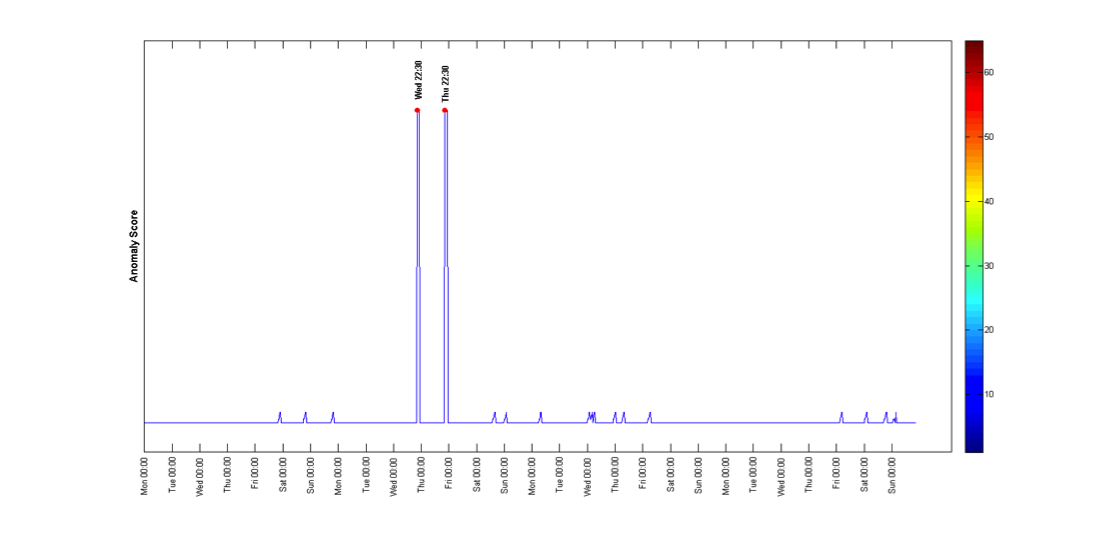
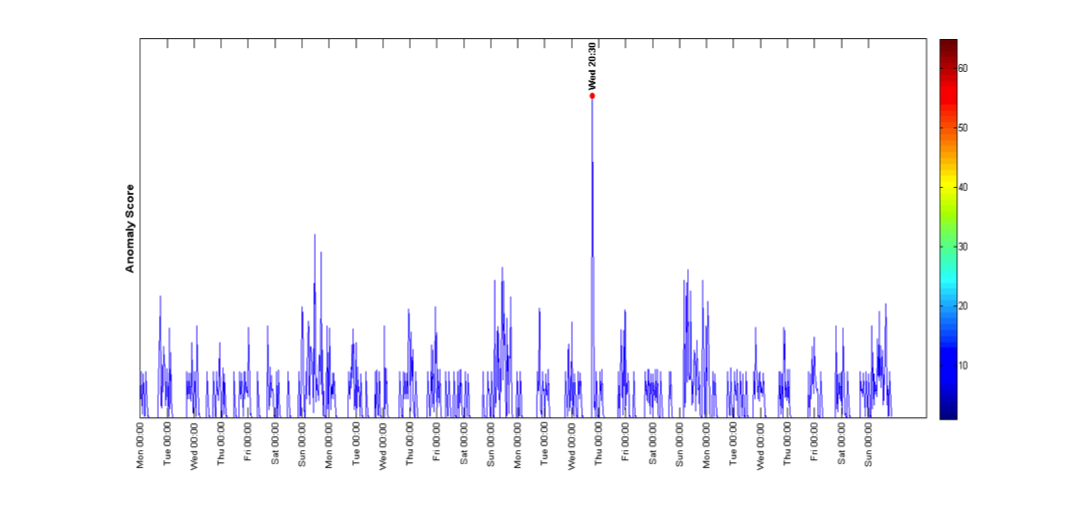
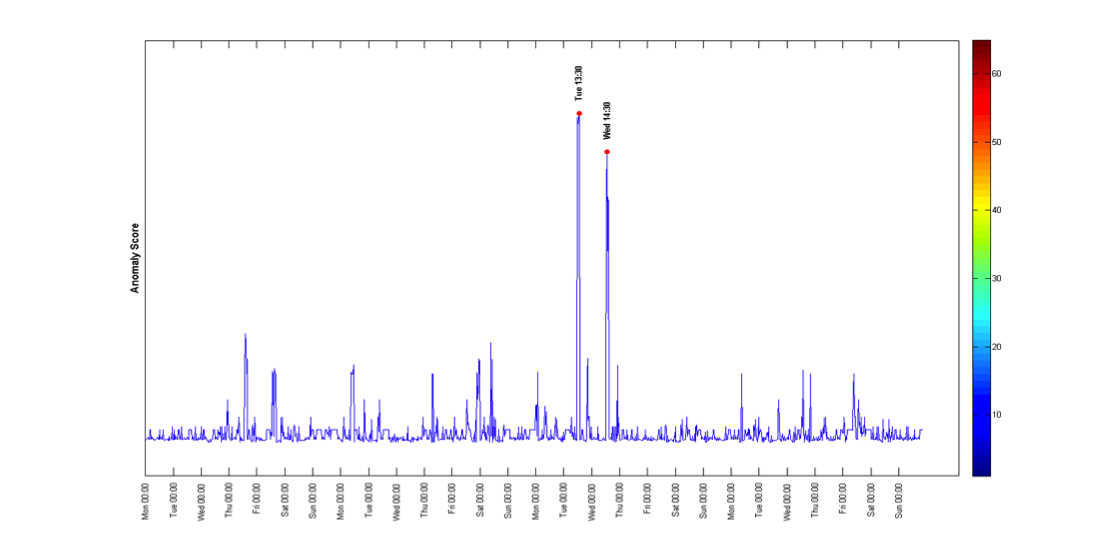
Conclusions and our solution
We developed a system that can detect anomalous connections and links based on car traffic between different locations. The system learns the normal and expected profile
of the various locations and then it looks for deviations from the expected behavior.
The system is based on our advanced technologies for processing, analyzing and mining intelligence data.