Use case description
A 630 bed acute care facility in the States is using a Beckman-Coulter Gen-S to generate hemograms.
Every hemogram is analyzed manually by a physician or a specialist, based on their experience and knowledge.
Each hemogram contains between 30 to 100 numeric and nominal values. Hence, the manual analysis of is an exhaustive task but is also
prone to mis-detection of health problems.
Our challange was to detect anomalies in the high-dimensional hemograms, identify the features that contribute to the anomalous
behavior and provide a second opinion for the physician regarding the health problems that we found.
Our analysis
We used our data mining, anomaly detection and differential diagnosis technologies
to provide accurate patient profiling and inference methodologies in which anomalous subprofiles are extracted and compared to potentially
relevant cases. Our methodologies organize numerical medical data profiles into demographics and characteristics relevant for
inference and case tracking. As the model grows and its knowledge database is extended, the diagnostic and the prognostic become more
accurate and precise.
As an example, inputs from Hematology results are processed for anomaly characterization and compared with similar anomalies in a
database of 30,000 patients, provide diagnostic statistics, warning flags and risk assessment .
These are based on past prior experience, including diagnostics and treatment outcomes (collective experience).
The system was trained on this database of patients, built the learning knowledge base and used to analysis and diagnosis 5,000 new patients.
Our system identified successfully the main risks with very high accuracy (more than 96%) and very low false rate (less than 0.5%).
The main benefit is a real time assessment as well as diagnostic options based on comparable cases,
flags for risk and potential problems as illustrated in the following case acquired on 04/21/10.
The patient was diagnosed by our system with severe SIRS at a grade of 61%.
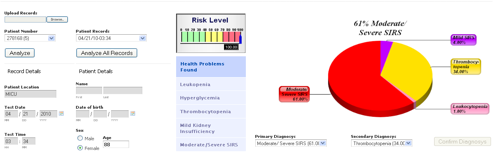
The patient was treated for SIRS and the blood tests were repeated during the following week. The full combined record of our system's assessment of the patient,
as derived from the further Hematology tests, is illustrated below. The yellow line shows the diagnosis that corresponds to the first blood test
(as also shown in the image above). The red line shows the next diagnosis that was performed a week later.

As we can see the following treatment, the SIRS risk as a major concern was eliminated and the system provides a positive feedback for the treatment of the physician.
Conclusions and our solution
We developed a system that is the equivalent of an intelligent Electronic Health Records Dashboard that provides empirical medical reference and suggests
quantitative diagnostics options.
Our dashboard is a visual display of essential metrics. The primary purpose is to gather medical information, generate metrics, analyze them in realtime
and provide a differential diagnosis, meeting the highest standard of accuracy. The diagnosis provides a risk assessment to the patient's medical
condition, while locating and presenting similar cases of other patients with the same anomalous profile and their corresponding treatment and followup.
Given medical information of a patient, the system builds its unique characterization and provides a list of other patients that share this unique profile,
therefore utilizing the vast aggregated knowledge (diagnosis, analysis, treatment, etc.) of the medical community.
The medical institution believes that the effect of implementing this diagnostic amplifier would result in higher physician productivity at a time of great human
resource limitations, safer prescribing practices, rapid identification of unusual patients, better assignment of patients to observation,
inpatient beds, intensive care, or referral to clinic, shortened length of patients ICU and bed days.